What if your smartphone choice today could lock you into limitations—or opportunities—for years to come? As the digital world evolves, the divide between the two dominant operating systems grows sharper. With Android powering 7 out of 10 devices globally and iOS capturing nearly a third of the market, your preference isn’t just about apps or aesthetics. It’s about aligning with an ecosystem that adapts to your lifestyle, budget, and future needs.
- Understanding the Smartphone Duopoly
- Android vs iOS: Which One Is Better for You in 2025?
- User Demographics and Economic Profiles
- Hardware and Software Differences
- Customization, Interface, and Usability
- App Ecosystem and Revenue Insights
- Security, Privacy, and Update Considerations
- Technological Innovations: AI, VR, and Foldables
- Market Trends and Global Reach
- Conclusion
- FAQ
These platforms aren’t just software—they’re gateways to how you interact with technology. Android’s open-source flexibility contrasts with iOS’s tightly integrated experience. But which prioritizes privacy? Which evolves faster with user-driven innovations? The answer shapes everything from app compatibility to device longevity.
By 2025, over 4 billion people will rely on these systems daily. Your decision impacts how you work, connect, and secure personal data. This article breaks down market trends, hidden costs, and feature roadmaps to help you choose wisely. Let’s cut through the hype.
Key Takeaways
- Android holds 70% global market share, while iOS dominates premium segments.
- User behavior trends reveal growing demand for cross-device integration.
- System functionalities increasingly prioritize AI-driven personalization.
- Key terms like “ecosystem lock-in” and “update cycles” shape long-term value.
- Detailed comparisons ahead will clarify costs, security, and customization.
Understanding the Smartphone Duopoly
Two titans control nearly every smartphone sold today, but their paths to dominance tell contrasting stories. While one thrives on universal accessibility, the other dominates premium segments through tight ecosystem control. Let’s dissect the numbers shaping this split.
Market Share Overview
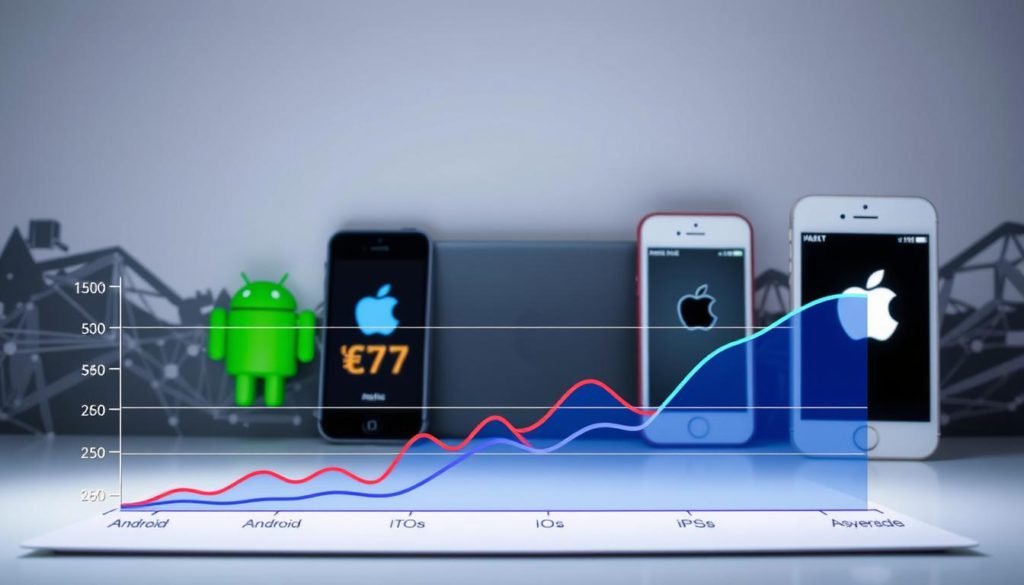
Android users represent 70% of global device owners, according to 2024 data. This spread reflects diverse price points—from $100 budget phones to $1,800 foldables. In contrast, iPhone users cluster in affluent markets, holding 58% of U.S. premium device sales.
Europe’s market reveals sharper divides. Android claims 65% of regional sales, while iOS leads in Scandinavia with 55% adoption. Emerging economies like India amplify Android’s reach, where 95% of new devices run the OS.
The Rise of Both Platforms Over Time
Since 2015, Android’s device variety fueled its growth—25+ brands offer models across 50+ countries. Apple’s strategy focuses on customer retention: 85% of iOS users stay within the ecosystem when upgrading.
The market shift toward 5G accelerated both platforms. Over 60% of 2024 smartphone shipments support next-gen networks, with Android manufacturers launching 3x more 5G models than Apple last year.
Android vs iOS: Which One Is Better for You in 2025?

Your mobile operating system choice directly shapes your digital opportunities. App creators and users face diverging paths: one platform offers broader reach, while the other delivers higher spending power. Market data reveals Apple’s store generates 75% more revenue per user than Google’s marketplace despite having fewer total apps.
Why Your Choice Matters Today
Monetization strategies split sharply between ecosystems. The Apple App Store thrives on in-app purchases and subscriptions, with users spending 2.3x more than Android counterparts. Google Play dominates install volumes—4.8 million apps versus Apple’s 2.2 million—but struggles with lower average revenue per download.
Your target audience’s habits dictate the smarter play. Luxury brands and SaaS companies often prioritize iOS for its affluent user base. Mass-market services lean toward Android’s global accessibility across 190 countries.
Key Considerations for Decision Makers
Development costs and timelines differ radically. Building for Apple’s ecosystem requires strict design guidelines and longer approval times. Android’s open-source flexibility speeds prototyping but increases fragmentation testing across 24,000+ device models.
Three factors should guide your strategy:
- Revenue models (subscriptions perform 68% better on iOS)
- Audience location (emerging markets favor Android)
- Update cycles (Apple’s OS adoption outpaces Android by 6:1)
Cross-platform tools like Flutter help bridge gaps, but native development still delivers superior performance. Choose based on where your users live—and how they spend.
User Demographics and Economic Profiles
Your smartphone choice reveals more than brand preference—it reflects your financial priorities and cultural influences. Over 60% of apple devices owners earn above $75k annually, compared to 42% of android devices users, per 2024 Pew Research data. This economic divide shapes app monetization strategies and ecosystem loyalty.
Income and Spending Habits
Price sensitivity drives platform adoption. Budget-conscious users gravitate toward Android’s $100-$400 devices, while Apple’s $800+ iPhones attract high earners. App spending mirrors this split:
| Metric | Apple Users | Android Users |
|---|---|---|
| Avg. In-App Spend/Month | $12.40 | $6.80 |
| Premium App Purchases | 68% | 29% |
| Ad-Supported Usage | 22% | 57% |
Age Group Preferences and Cultural Factors
Gen Z favors Android for customization and lower price points—55% use budget-friendly models. Apple dominates the 35-54 demographic (61% adoption), where ecosystem integration with Macs and Watches matters most.
Regional trends deepen these divides. Urban professionals in coastal U.S. cities overwhelmingly choose apple devices, while Android leads in rural areas (63% market share). Cultural perceptions play roles too—Apple symbolizes status in Asia, whereas Europe values Android’s open-source flexibility.
Hardware and Software Differences

Your device’s physical components and operating system work in tandem to define daily interactions. While some prioritize raw power, others focus on seamless synergy between parts. Let’s examine how these technical foundations shape user experiences.
Device Variety and Performance
Android manufacturers offer over 500 distinct hardware models annually—from $150 entry-level phones to $2,000 foldables. This diversity lets you match specs to budgets but creates performance inconsistencies. Budget devices often use older chipsets, while flagships rival Apple’s processing speeds.
Apple’s limited hardware lineup ensures optimized performance. Their custom A-series chips outperform most Android rivals in single-core tasks. Recent tests show iPhone 15 Pro renders 4K video 22% faster than Samsung’s Galaxy S24 Ultra.
Exclusive Features of Apple and Android Devices
iOS thrives on software-hardware integration. Features like FaceID and AirDrop leverage proprietary sensors and chips. Android’s open ecosystem enables innovations like periscope camera systems and 200W fast charging—tech rarely found in iPhones.
Key exclusives shaping 2025 experiences:
- Apple’s LiDAR scanners enable AR precision
- Android’s AI-driven photo enhancers
- Proprietary satellite connectivity in newer iPhone models
| Feature | Apple Advantage | Android Advantage |
|---|---|---|
| Processing Power | Benchmark leader | Multi-core optimization |
| Camera Flexibility | Cinematic video modes | 10x optical zoom options |
| Battery Tech | Efficient power management | Ultra-fast charging |
Customization, Interface, and Usability
Your smartphone’s interface acts as your digital fingerprint—how easily can you mold it to reflect your habits? While some crave endless tweaking, others prefer simplicity that “just works.” This divide defines today’s mobile experience.
Personalizing Your Smartphone Experience
The open-source platform lets you rearrange icons freely, layer widgets, and install third-party launchers. Dynamic wallpapers shift with time or weather, while app grids break traditional layouts. Want a minimalist setup or info-packed screens? The options are yours.
In contrast, the closed ecosystem maintains strict visual order. Apps auto-align into grids, with limited widget placement. This uniformity ensures consistency across devices but restricts creative layouts. One study found 78% of power users prefer Android’s flexibility, while 64% of professionals favor iOS’s predictability.
| Feature | Customization Leader | Simplicity Advantage |
|---|---|---|
| Home Screens | Multi-layer widgets | Auto-organized grids |
| Themes | Third-party packs | Pre-set color palettes |
| Notification Control | Per-app priority settings | Unified management hub |
Notifications reveal another split. The open system allows granular controls—mute specific senders or delay alerts until lunch. The rival OS groups updates by app type, reducing clutter but offering fewer filtering tools.
More customization means higher maintenance. Third-party launchers sometimes lag during updates, while locked-down interfaces rarely crash. Choose based on whether you value creative freedom or rock-solid reliability.
App Ecosystem and Revenue Insights
The battle for app dominance isn’t just about quantity—it’s a strategic play where revenue tells the real story. SensorTower data reveals Google Play hosts 3.5 million apps versus Apple’s 2.2 million, yet the latter generates 75% more annual revenue. This gap forces developers to choose between reach and profitability.
Comparing the Apple App Store and Google Play
More apps don’t equal higher earnings. Statista reports Apple’s store earned $85 billion in 2024—double Google Play’s $42 billion. Why? iPhone users spend 2.8x more per transaction. Approval processes also differ:
| Factor | Apple App Store | Google Play |
|---|---|---|
| Approval Time | 3-7 days | 1-3 days |
| Revenue Share | 15-30% | 15% |
| Global Availability | 175 countries | 190 countries |
Monetization and In-App Purchases
Subscription models thrive on Apple’s platform—68% of top-grossing apps use recurring payments. Google Play sees success with ad-supported free downloads. Key considerations for developers:
- iOS users pay $12.40/month on average for in-app features
- Android’s install volume is 2.1x higher globally
- Apple enforces stricter privacy rules for ad tracking
Your monetization strategy hinges on audience behavior. Target affluent markets? Prioritize the store with higher spending power. Building for mass adoption? The Play Store offers broader reach at lower costs per install.
Security, Privacy, and Update Considerations
Every swipe and tap leaves digital footprints—how well does your device guard them? Modern security isn’t just antivirus scans; it’s about layered protections that evolve with emerging threats. Both major platforms approach this challenge differently, shaping your defense against data breaches and malware.
The closed system uses hardware-level encryption, locking biometric data in a secure enclave. Third-party apps face strict sandboxing rules, limiting access to sensitive information. Open-source platforms offer granular control over permissions but rely on manufacturers to patch vulnerabilities promptly.
| Feature | Closed Ecosystem | Open-Source Platform |
|---|---|---|
| Data Encryption | End-to-end by default | Optional device-level |
| Update Frequency | 5+ years guaranteed | 2-3 years average |
| App Vetting Process | Manual review | Automated scans |
Regular updates are your first line of defense. One system delivers patches simultaneously to all supported devices, while the other depends on carriers and manufacturers. Over 90% of closed ecosystem users receive critical security fixes within a week—triple the adoption rate of its counterpart.
Your choice affects long-term support. Flagship devices from open-source partners now promise 4-year update cycles, but budget models often stop after 18 months. Privacy tools like approximate location sharing and one-time permissions help both platforms minimize data exposure.
Technological Innovations: AI, VR, and Foldables

The next generation of mobile tech isn’t just faster—it’s learning, bending, and reshaping reality itself. By 2025, systems will anticipate your needs before you open an app, while foldable screens redefine what phones can physically become. These breakthroughs demand your attention now, as today’s choices shape tomorrow’s capabilities.
Advancements in Artificial Intelligence
Your smartphone now acts as an AI co-pilot. Real-time language translation works offline, while cameras adjust settings based on your photography habits. One study found these systems reduce photo editing time by 63% compared to manual adjustments.
| AI Feature | 2024 Availability | 2025 Projection |
|---|---|---|
| Predictive Text | Basic suggestions | Full sentence completion |
| Battery Management | Adaptive charging | Usage pattern prediction |
| Camera Optimization | Scene detection | Subject tracking AI |
Emerging Trends in Virtual and Augmented Reality
AR navigation overlays will soon project directions onto real streets through your phone’s camera. VR systems are shrinking—new headsets connect wirelessly to phones, offering console-grade graphics.
“Mobile VR adoption will triple in two years as hardware costs drop 40%,”
notes TechTrends analyst Mara Lin.
The Future of Foldable Smartphones
Once bulky novelties, foldables now compete with traditional smartphones in durability. Sales data shows 18 million units shipped last year—a 210% jump from 2022. Key improvements driving adoption:
- Crease-free displays arriving in late 2025
- Water resistance matching slab-style phones
- App interfaces that adapt to screen shapes
Price drops will accelerate adoption—analysts predict $699 foldables within three years. As screens become more durable, these devices could dominate the premium market by 2028.
Market Trends and Global Reach
Global smartphone adoption patterns reveal a tale of two economies. Mature markets prioritize premium experiences, while emerging regions drive growth through accessibility. Your location shapes which devices dominate local shelves—and why.
Regional Adoption Drivers
Southeast Asia and Africa show explosive demand for budget-friendly phones. Over 80% of sales here fall below $300, favoring brands offering variety in specs and payment plans. In contrast, North America and Western Europe see 58% of buyers choosing iPhones priced above $800.
| Region | Dominant Platform | Avg. Price | Key Adoption Factor |
|---|---|---|---|
| India | Open-source OS | $160 | Device financing options |
| United States | Apple ecosystem | $950 | 5G network compatibility |
| Brazil | Android-based | $220 | Dual SIM support |
Carrier partnerships sway choices too. U.S. operators push iPhone upgrades through trade-in deals, while African retailers bundle Android devices with prepaid data. Cultural perceptions matter—73% of Chinese consumers view iPhones as status symbols, per 2024 Kantar surveys.
Local regulations also play roles. Europe’s push for USB-C standardization impacted Apple’s design shifts, whereas India’s production incentives boosted Android manufacturing. These factors create distinct variety landscapes—one shaped by luxury, the other by necessity.
Conclusion
Your mobile ecosystem choice hinges on balancing priorities. The app store you engage with shapes spending habits—Apple’s platform drives 75% higher revenue per user, while Google’s offers wider global reach. Budget flexibility? Diverse hardware options cater to cost-conscious users. Premium integration? Seamless device synergy appeals to productivity-focused professionals.
Security needs and update reliability further split the decision. Closed systems provide consistent encryption and patches, whereas open platforms allow deeper customization. Developers face similar trade-offs: stricter Apple App guidelines versus Android’s fragmented device testing.
Ultimately, align your pick with core needs. Prioritize privacy and long-term updates? Lean toward controlled ecosystems. Value adaptability and varied price points? Embrace open-source versatility. Both platforms excel—your lifestyle dictates which strengths matter most.
FAQ
Which platform offers better customization options?
Google’s ecosystem allows deeper personalization for home screens, widgets, and default apps. Apple prioritizes a uniform interface but has added limited customization in recent updates.
How do app stores differ in revenue opportunities?
The Apple App Store generates higher revenue per user, but Google Play has a larger global install base. Developers often prioritize iOS for paid apps and subscriptions.
Which operating system provides stronger privacy controls?
iOS includes features like App Tracking Transparency and on-device processing for sensitive data. Android offers granular permissions but varies by manufacturer.
Are software updates faster on one platform?
Apple devices receive updates immediately, while Android updates depend on manufacturers. Google Pixel models get priority, but others face delays.
Do budget-friendly options differ between ecosystems?
Android offers devices at nearly every price point, including sub-0 models. iPhones start at higher prices but retain resale value longer.
Which ecosystem integrates better with smart home devices?
Android works seamlessly with Google Nest and third-party products. Apple HomeKit provides tighter security but requires certified accessories.
How do camera systems compare between flagships?
Recent iPhones emphasize color accuracy and video stabilization. Top Android models like Samsung Galaxy S24 Ultra offer higher zoom capabilities and AI-enhanced editing.
Can you switch ecosystems without losing data?
Moving from iOS to Android (or vice versa) requires manual transfers for messages and photos. Some subscription services or app purchases don’t carry over.
Which platform leads in foldable phone innovation?
Android manufacturers like Samsung and Google currently dominate foldable designs. Apple hasn’t released a foldable iPhone but holds related patents.
Are regional app preferences a factor?
Yes. Super-apps like WeChat dominate in Asia, while services like Google Maps have wider integration in Android globally. iOS excels in region-specific banking apps in Western markets.
